Summarize and Plot Columns of a Data Frame
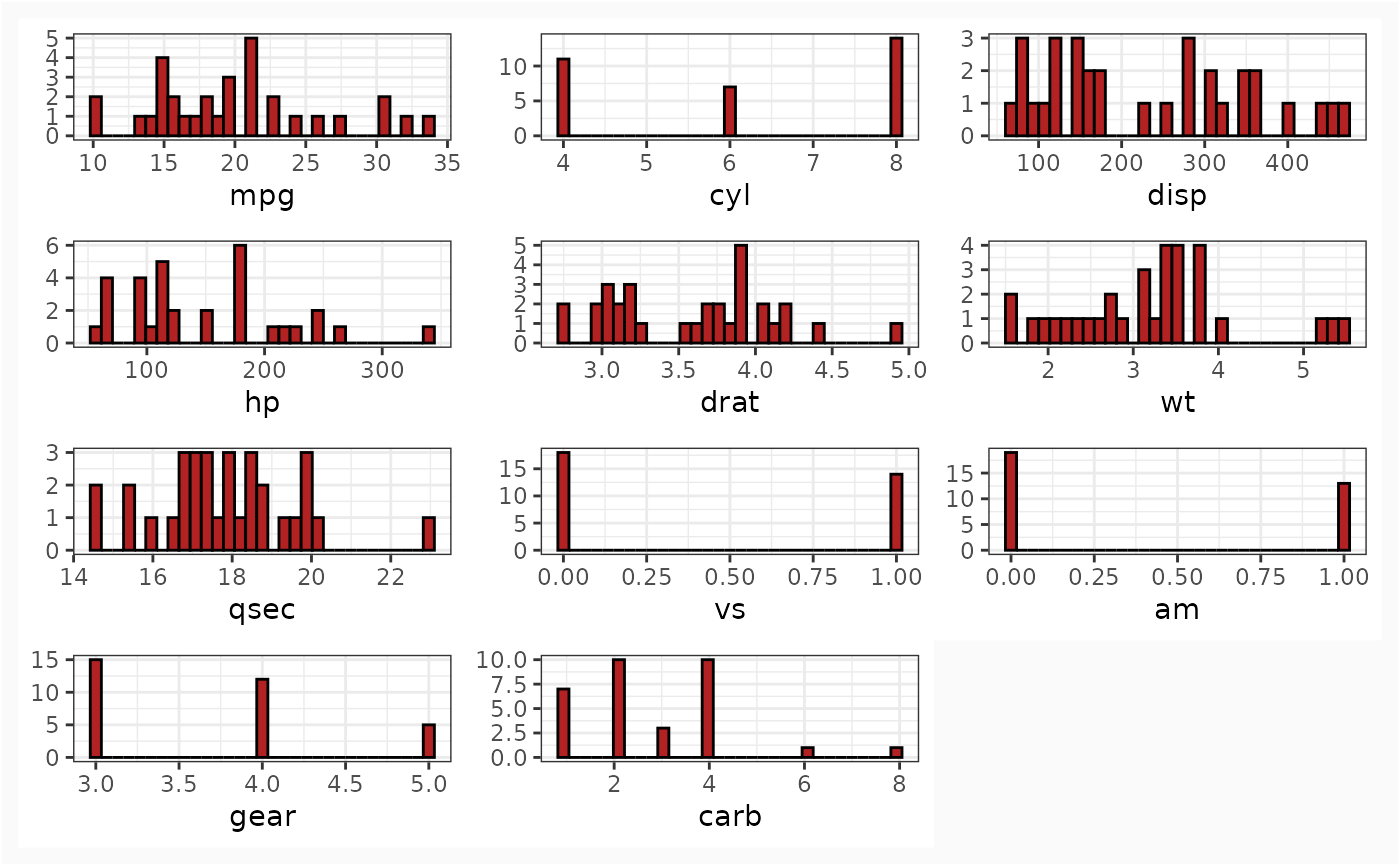
summarize_plots.RdThis function generates summary plots for each column in a data frame. For numeric columns, it produces histograms, and for factor or character columns, it creates bar plots of the frequencies.
summarize_plots(df, ncol = 3, fill = "firebrick", width = 10, height = 4, ...)Arguments
- df
A data frame to summarize and plot.
- ncol
An integer specifying the number of columns to arrange the plots in (default: 3). This parameter is useful when displaying plots in a grid.
- fill
A string specifying the fill color for the bars in histograms or bar plots (default: "firebrick").
- width
Numeric value specifying the width of the plot (default: 10).
- height
Numeric value specifying the height of the plot (default: 4).
- ...
Additional arguments passed to
patchwork::wrap_plots()for customizing the layout.
Value
A combined patchwork of ggplot2 objects arranged in a grid, where each plot corresponds
to one of the columns of the data frame.
Details
This function checks the data type of each column in the provided data frame.
For numeric columns, it creates histograms showing the distribution of the values.
For categorical columns (factors or characters), it converts any character columns to factors and generates bar plots showing the counts of each level.
The function returns a combined set of plots arranged in a grid using patchwork::wrap_plots.
You can control the number of columns in the grid using the ncol argument.
Examples
# Example with the mtcars dataset
summarize_plots(mtcars)
