Plot Regression Coefficients
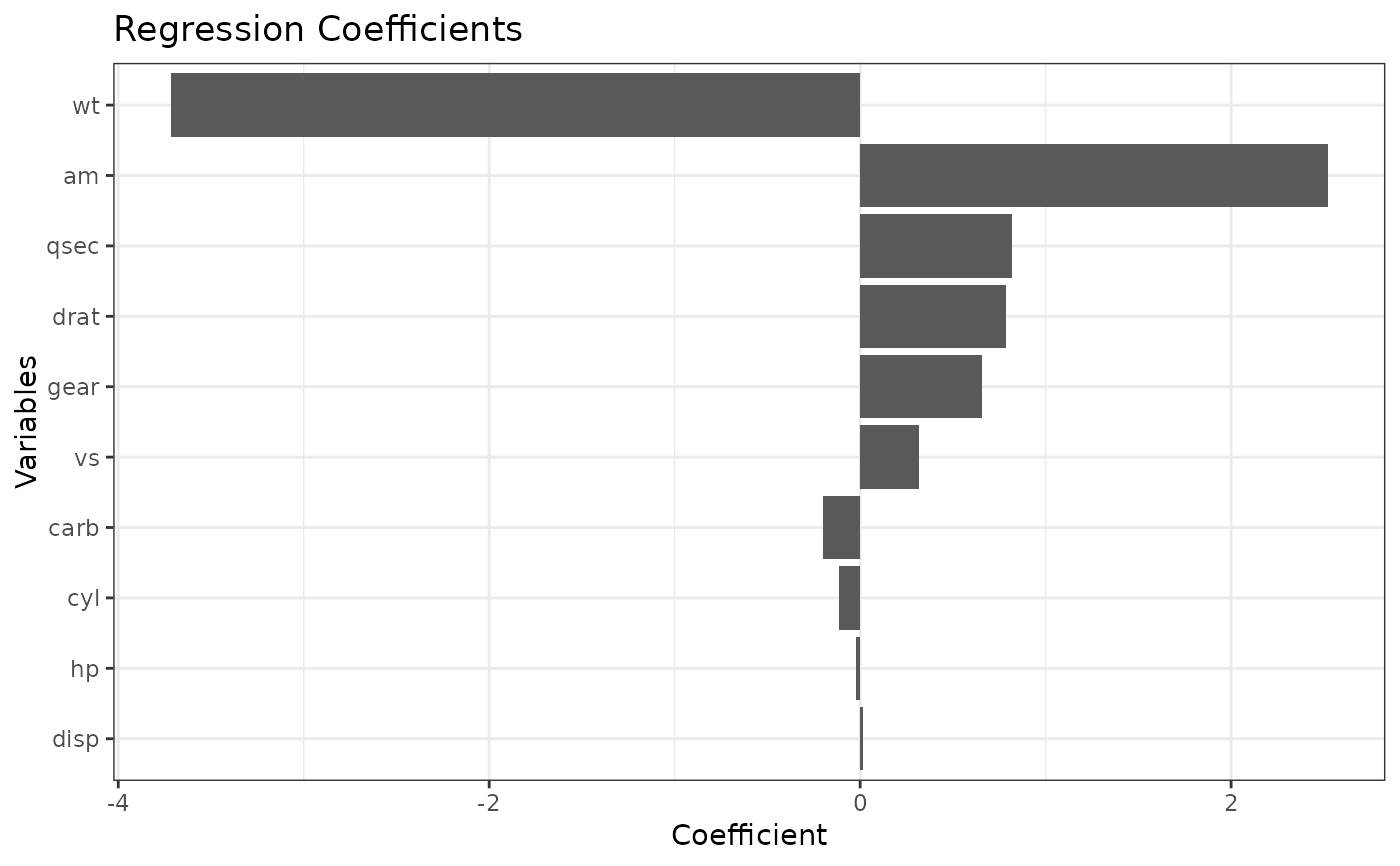
plot_coef.RdThis function creates a bar plot to visualize regression coefficients, with optional ordering, intercept removal, and coefficient selection.
plot_coef(
  coefficients,
  remove_intercept = FALSE,
  order_coef = TRUE,
  select = NULL,
  title = "Regression Coefficients"
)
Arguments
- coefficients
A named vector or data frame of regression coefficients.
- remove_intercept
Logical. If TRUE, the intercept (first row) will be removed from the plot (default: FALSE).
- order_coef
Logical. If TRUE, the coefficients will be sorted by absolute value before plotting (default: TRUE).
- select
A logical vector to specify which coefficients are selected. If provided, the plot will highlight selected coefficients (default: NULL).
- title
A character string specifying the title of the plot (default: "Regression Coefficients").
Value
A ggplot object displaying the regression coefficients as a bar plot.
Details
This function takes regression coefficients and creates a horizontal bar plot. It allows for sorting by the absolute value of coefficients, removing the intercept, and highlighting selected coefficients if a logical vector is provided. The plot is useful for interpreting regression models.
