Draw a normal distribution plot using ggplot2
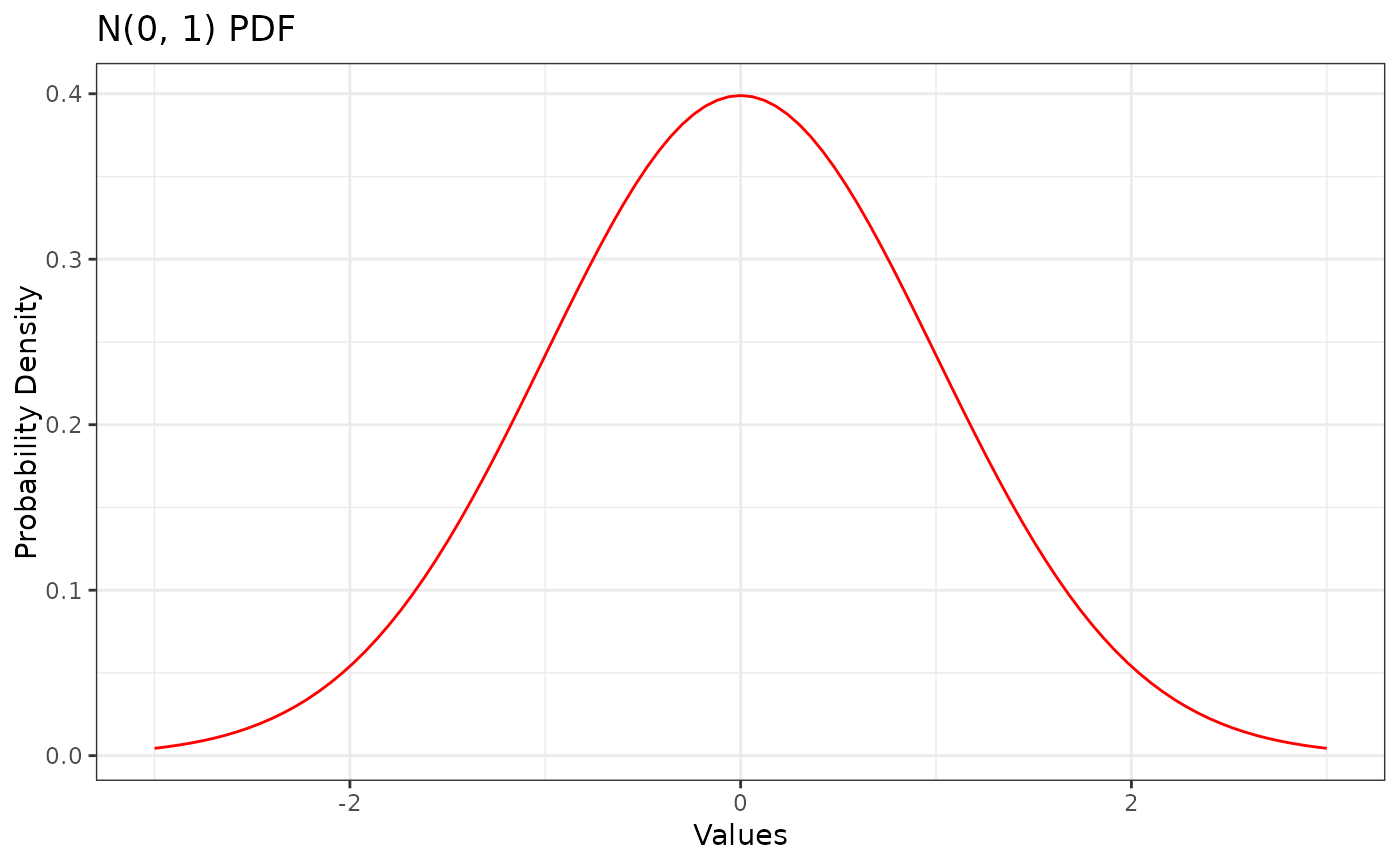
draw_normal.RdThis function creates a ggplot2 plot representing the probability density function (PDF) of a normal distribution with a specified mean and standard deviation.
draw_normal(mu = 0, sd = 1, color_density = "blue")Arguments
Value
A ggplot2 object representing the normal distribution plot.
Examples
draw_normal(mu = 0, sd = 1, color_density = "red")
